U.S. stock market finished higher on Friday as investors cheered for better-than-expected July job report.
The Dow Jones industrial average was up for the eighth consecutive session and reached an all-time high to settle at 22,092.81, mostly driven by Goldman Sachs. The S&P 500 rose 4.67 points (0.19%) to close at 2,476.83, led by the financials sector. The tech-heavy Nasdaq composite advanced 11.22 points to finish at 6,351.56. For the week ended August 4, Dow Jones maintained its winning streak and outperformed again, S&P 500 climbed back into the green and Nasdaq stayed in the red.
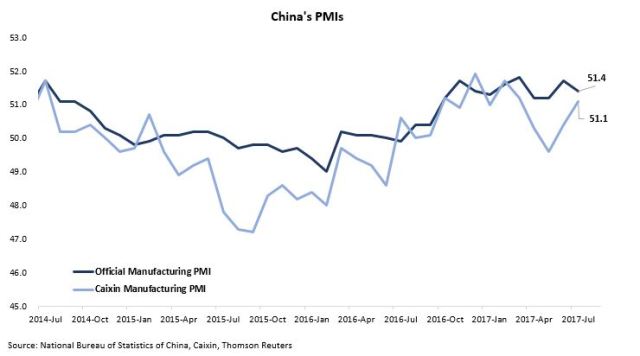
On Monday, the Caixin China manufacturing Purchasing Managers’ Index (PMI) rose to 51.1 in July (vs. 50.4 in June), underpinned by a solid increase in new business, after hitting a 11-month low of 49.6 in May. However, the official manufacturing PMI reading slipped to 51.4 in July (vs. 51.7 in June), driven by adverse weather conditions and flooding in parts of the country, according to officials from the National Bureau of Statistics. Nonetheless, the two gauges continued to converge in the past several months. Note that, the official reading surveys 3,000 manufacturers across the nation, while Caixin bases its results on data compiled from questionnaires sent to 400 private companies.
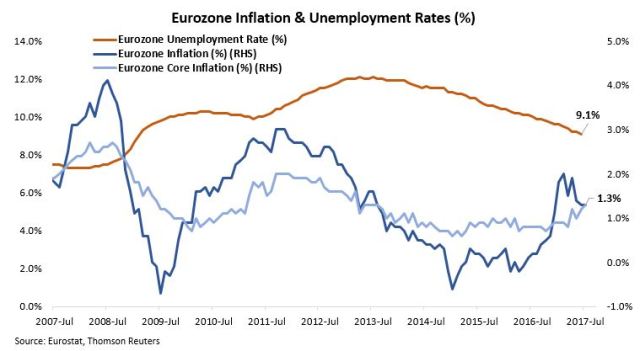
On to the eurozone, the nation’s unemployment rate fell to 9.1% in June (vs. 9.2% in May), the lowest level since February 2009. On the other hand, inflation data remained subdued as the headline inflation figure stood flat at 1.3% in June and core inflation advanced to 1.3% in July (vs. 1.2 in June). Considering the continued weakness in energy prices, eurozone’s inflation could remain soft in the near future.
On Tuesday, U.S. reported worse-than-expected ISM manufacturing PMI result, slowing to 56.3 in July (vs. 57.8 in June), below the street consensus of 56.5. This is mainly attributable to the slowdown in new & backlog orders, production, and employment indexes (see below snapshot).
 Source: ISM
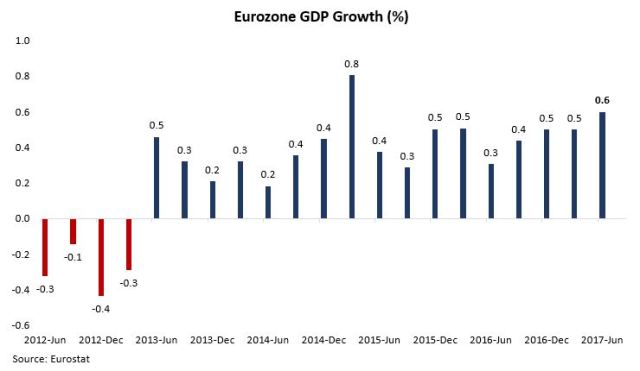
In addition, the eurozone reported solid Q2 2017 GDP result, coming in at 0.6% YoY (vs. 0.5% in Q1) or 2.3% on an annualized basis. The above-2% annualized growth rate is likely to further encourage the European Central Bank, which would want to decide probably this September, to taper its asset purchases starting in early 2018.
On Wednesday, Reserve Bank of India (RBI) cut its lending rate to 6.00% (from 6.25%) amid a slowdown in economic growth and inflation. Perhaps the recent fallout in manufacturing PMI was one of the drivers behind RBI’s monetary decision.

Further, U.S. ADP reported that the private payrolls grew by 178,000 in July (vs. 191,000 in June), shy of the street consensus of 185,000 jobs, as an increase in service occupations more than offset a decrease in manufacturing jobs (see below summary).
 Source: ADP
Speaking about payrolls, consumers in Japan continued to exhibit confidence in the economy despite their real wage growth has entered the negative territory in June.

Additionally, the nation’s labour shortage remains problematic, especially in the non-manufacturing sector (figures below 0 indicates labour shortage).

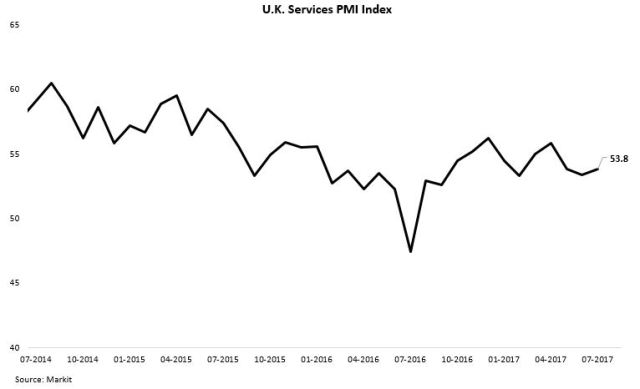
On Thursday, U.K. reported solid services PMI data, inching up to 53.8 in July (vs. 53.4 in June). However, this “signaled a slower rate of business activity growth than the post-crisis trend” and “…putting the country on course for another steady but
sluggish expansion in the third quarter”, according to IHS Markit.
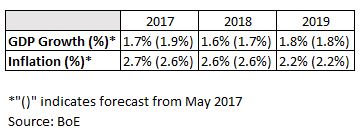
In addition, Bank of England (BoE) concluded its Monetary Policy Committee (MPC) meeting and held its interest rate steady at 0.25% as six out of the eight MPC officials voted in favor of keeping rates at record low levels (full statement, minutes, inflation report). The MPC also pointed out it is expected to hike rates twice over the next three years (vs. once stated previously).
Further, on the GDP front, BoE revised it downward to 1.7% (from 1.9%) for 2017 and 1.6% (from 1.7%) for 2018, while keeping its 2019 projection unchanged at 1.8%. For inflation outlook, BoE broadly maintained its forecast as laid out in May, but it emphasized there will be significant upward pressure in the coming months to push inflation higher to about 3% before it normalizes. Refer to below forecast revision summary.
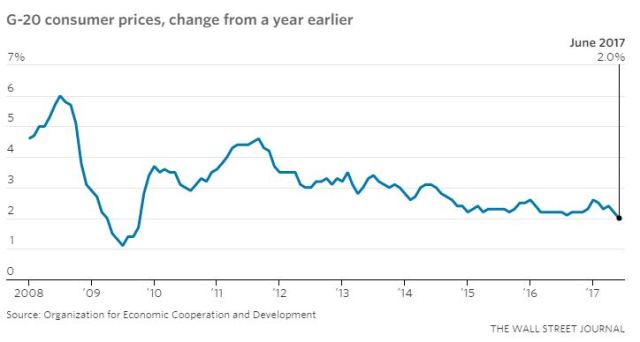
Perhaps soft inflation has become a global theme in the near term considering inflation pressure across G-20 economies has fallen to 2% in June, the lowest level since 2009.
 Source: WSJ
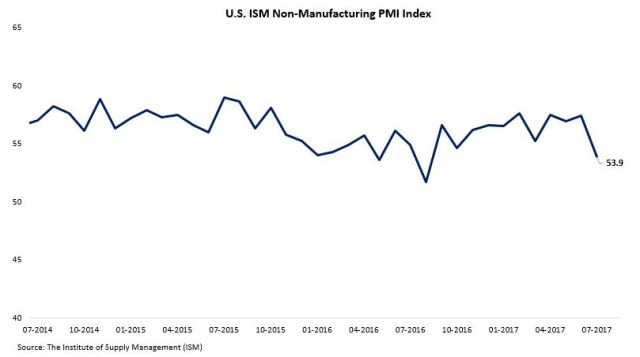
On to the U.S., the nation’s ISM non-manufacturing PMI result surprised to the downside, dipping to 53.9 in July (vs. 57.4 in June), suggesting the growth of the service sector could be decelerating. The slowdown is mainly attributable to business activity, new orders, and employment indexes. See below summary.
 Source: ISM
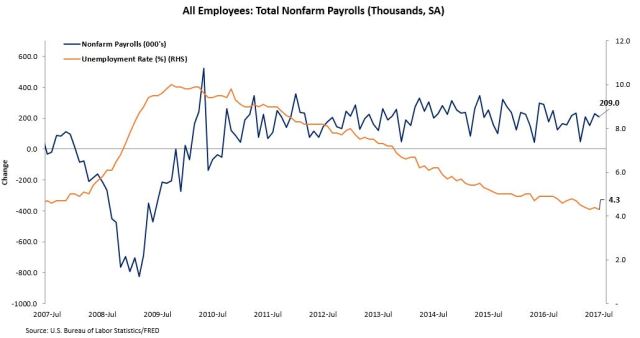
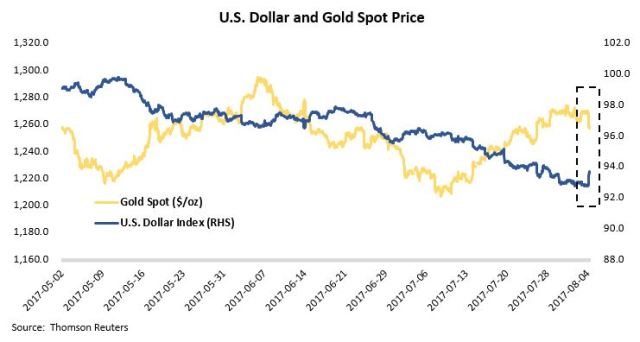
On Friday, U.S. added 209,000 jobs in July (vs. 231,000 in June) to the economy, beating the street forecasts of 180,000. The unemployment rate dropped to 4.3% (vs. 4.4% in June). In addition, earnings growth remained solid in relation to weak inflation rate. Looking ahead, the ultra low level of unemployment rate should spark stronger gains in wage down the road, a belief held by the Federal Reserve.

The strong job figures sent U.S. dollar higher and gold lower as the case for another rate hike in 2017 strengthens.
Lastly, here is a short and sweet article on bubbles in financial markets. Where do we go from here pertaining to territories such as the stock market, the mount of piling debt in the consumer and residential mortgage sectors, and perhaps the crypto-currency space.
The week ahead (a light week on economic indicators): China will release its July consumer & producer price indexes on Wednesday (Aug 9); U.K. will report its June industrial production figure and U.S. will release its July producer price index on Thursday (Aug 10); U.S. will report its July consumer price index on Friday (Aug 11).


 Tops News
Market Commentary – August 4, 2017
U.S. stock market finished higher on Friday as investors cheered for better-than-expected July job report.
The Dow Jones industrial average was up for the eighth consecutive session and reached an all-time high to settle at 22,092.81, mostly driven by Goldman Sachs. The S&P 500 rose 4.67 points (0.19%) to close at 2,476.83, led by the financials sector. The tech-heavy Nasdaq composite advanced 11.22 points to finish at 6,351.56. For the week ended August 4, Dow Jones maintained its winning streak and outperformed again, S&P 500 climbed back into the green and Nasdaq stayed in the red.
On Monday, the Caixin China manufacturing Purchasing Managers’ Index (PMI) rose to 51.1 in July (vs. 50.4 in June), underpinned by a solid increase in new business, after hitting a 11-month low of 49.6 in May. However, the official manufacturing PMI reading slipped to 51.4 in July (vs. 51.7 in June), driven by adverse weather conditions and flooding in parts of the country, according to officials from the National Bureau of Statistics. Nonetheless, the two gauges continued to converge in the past several months. Note that, the official reading surveys 3,000 manufacturers across the nation, while Caixin bases its results on data compiled from questionnaires sent to 400 private companies.
On to the eurozone, the nation’s unemployment rate fell to 9.1% in June (vs. 9.2% in May), the lowest level since February 2009. On the other hand, inflation data remained subdued as the headline inflation figure stood flat at 1.3% in June and core inflation advanced to 1.3% in July (vs. 1.2 in June). Considering the continued weakness in energy prices, eurozone’s inflation could remain soft in the near future.
On Tuesday, U.S. reported worse-than-expected ISM manufacturing PMI result, slowing to 56.3 in July (vs. 57.8 in June), below the street consensus of 56.5. This is mainly attributable to the slowdown in new & backlog orders, production, and employment indexes (see below snapshot).
In addition, the eurozone reported solid Q2 2017 GDP result, coming in at 0.6% YoY (vs. 0.5% in Q1) or 2.3% on an annualized basis. The above-2% annualized growth rate is likely to further encourage the European Central Bank, which would want to decide probably this September, to taper its asset purchases starting in early 2018.
On Wednesday, Reserve Bank of India (RBI) cut its lending rate to 6.00% (from 6.25%) amid a slowdown in economic growth and inflation. Perhaps the recent fallout in manufacturing PMI was one of the drivers behind RBI’s monetary decision.
Further, U.S. ADP reported that the private payrolls grew by 178,000 in July (vs. 191,000 in June), shy of the street consensus of 185,000 jobs, as an increase in service occupations more than offset a decrease in manufacturing jobs (see below summary).
Speaking about payrolls, consumers in Japan continued to exhibit confidence in the economy despite their real wage growth has entered the negative territory in June.
Additionally, the nation’s labour shortage remains problematic, especially in the non-manufacturing sector (figures below 0 indicates labour shortage).
On Thursday, U.K. reported solid services PMI data, inching up to 53.8 in July (vs. 53.4 in June). However, this “signaled a slower rate of business activity growth than the post-crisis trend” and “…putting the country on course for another steady but
sluggish expansion in the third quarter”, according to IHS Markit.
In addition, Bank of England (BoE) concluded its Monetary Policy Committee (MPC) meeting and held its interest rate steady at 0.25% as six out of the eight MPC officials voted in favor of keeping rates at record low levels (full statement, minutes, inflation report). The MPC also pointed out it is expected to hike rates twice over the next three years (vs. once stated previously).
Further, on the GDP front, BoE revised it downward to 1.7% (from 1.9%) for 2017 and 1.6% (from 1.7%) for 2018, while keeping its 2019 projection unchanged at 1.8%. For inflation outlook, BoE broadly maintained its forecast as laid out in May, but it emphasized there will be significant upward pressure in the coming months to push inflation higher to about 3% before it normalizes. Refer to below forecast revision summary.
Perhaps soft inflation has become a global theme in the near term considering inflation pressure across G-20 economies has fallen to 2% in June, the lowest level since 2009.
On to the U.S., the nation’s ISM non-manufacturing PMI result surprised to the downside, dipping to 53.9 in July (vs. 57.4 in June), suggesting the growth of the service sector could be decelerating. The slowdown is mainly attributable to business activity, new orders, and employment indexes. See below summary.
On Friday, U.S. added 209,000 jobs in July (vs. 231,000 in June) to the economy, beating the street forecasts of 180,000. The unemployment rate dropped to 4.3% (vs. 4.4% in June). In addition, earnings growth remained solid in relation to weak inflation rate. Looking ahead, the ultra low level of unemployment rate should spark stronger gains in wage down the road, a belief held by the Federal Reserve.
The strong job figures sent U.S. dollar higher and gold lower as the case for another rate hike in 2017 strengthens.
Lastly, here is a short and sweet article on bubbles in financial markets. Where do we go from here pertaining to territories such as the stock market, the mount of piling debt in the consumer and residential mortgage sectors, and perhaps the crypto-currency space.
The week ahead (a light week on economic indicators): China will release its July consumer & producer price indexes on Wednesday (Aug 9); U.K. will report its June industrial production figure and U.S. will release its July producer price index on Thursday (Aug 10); U.S. will report its July consumer price index on Friday (Aug 11).
Share this:
About AM_Journey
A small potato working on Bay Street