See Here for a short version pitch for GameStop Corp. (GME)
Investment Thesis:
Growth Profile of Non-core Businesses:
- The Technology Brands segment is expected to deliver strong growth and profitability by rapidly expanding its footprint (CAGR: 32% Sales & 65% EBIT into 2019 from 2015)
- Digital business has grown to a $1 Billion business at a 29% CAGR since 2010, and Collectibles will be another growth engine and it is expected to triple its sales to $1 Billion by 2019
Physical (Core) Video Games Remain Relevant:
- Likely to bode well as the firm enters into new console cycle (expected to start in 2017 -2018). Current console cycle started in 2013. Note that console cycle typically lasts for 4 – 7 years based on historical data from Nintendo/Microsoft/Sony
- Pre-owned game sales are expected to peak towards the end of the current console cycle as video gamers transition from existing consoles to new consoles
Significant Shareholder Return:
- Stable capital returns in a range between $300 – $500 million via stock repurchases and dividends; represent 61 – 74% FCF on average since 2013
- Attractive dividend yield of ~4.8%
Multiple Expansion:
- Valuation has been unwarrantedly compressed due to concerns over the prospects of the physical game segment; EBITDA multiple and P/E multiple are trading at a discount to industry average of 11.3x & 15.8x
- Expect multiples to rise as opportunities inside/outside of the firm start to materialize
Company Description:
GameStop Crop. is the world’s largest omni-channel video game retailer. The company sells new and pre-owned video game hardware, physical and digital video game software, accessories, as well as PC entertainment software, new and pre-owned mobile and consumer electronics products and other merchandise.
The company operates over 7,000 stores, in the United States, Australia, Canada and Europe with more than 40,600 employees worldwide and its headquarter in Texas, USA.
Business Segments:
The Company is divided into two major business segments: Video Game Brands and Technology Brands.
Video Game Brands, as the core business with over 6,000 stores, is in turn spread out geographically among United States (>4,000 stores), Canada (>300 stores), Australia (>400 stores), and Europe (~1,300 stores).
Technology Brands, on the other hand, is currently accounted for 6% (>$500 Mil.) of the business revenue, is expected to grow aggressively to deliver ~$1.6 Billion of sales by 2019. This business initiative is recently attested by GameStop’s acquisition of 507 AT&T dealer stores for $475 Million, which lifts the number of stores within the Technology Brands space to over 1,500 (from ~1,000).
Products & Services Segments:
The Company categorizes its products and services as follows:
New Hardware: offers video game platforms of all major console manufacturers
- Sony: PlayStation series
- Microsoft: Xbox One, Xbos 360, and Kinect
- Nintendo: Wii series
New Software: Purchase and resell new video games from aforementioned manufacturers as well as independent game publishers such as Electronic Arts and Activision
Pre-owned Software: Customers trade in used games for store credit and the Company resells them at a slight discount to their original prices, higher margin business
Accessories: Controllers, gaming headsets, memory cards, and so forth
Digital: Online subscription, digital currency, and downloadable content
Mobile & Consumer Electronics: Revenue primarily coming from the Technology Brands segment through Spring Mobile managed AT&T and Cricket branded stores, Simply Mac stores from the sale of wireless products, and Apple and other consumer electronics
Others: Licensed merchandise and collectibles

FY2015

Revenue Breakdown (FY2015)
Industry Overview:
The Video Games industry has been growing steadily in the five years into 2016 with an average annual rate of 4%, despite the intense competition among game developers & retailers as well as the emergence of low-cost mobile/digital games. However, industry growth has been stagnant for the first half of 2016 as there has been a longer-than-expected wait time for release of new consoles. The recent release of Kinect (aka a motion sensor for the Xbox 360) has re-ignited the excitement about what is yet to be released by other companies, such as Nintendo NX and Xbox 2.
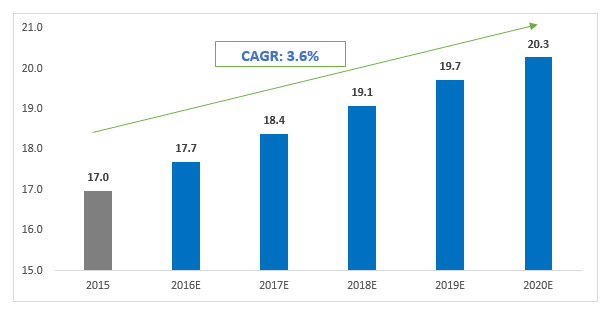
Future growth expectations for the industry is expected to be steady as the historical trend at an average of 3.6% on a CAGR basis. In addition, digital games market is expected to share a larger slice of the industry’s overall gaming revenue, as evidenced by its extensive growth thanks to the expansive mobile gaming market as well as the broader global access to the Internet. On the upside, while it might be too early to attest, the Video Games industry is likely to accelerate as a significant amount of funding has been invested in the development and improvement of the Virtual Reality (VR) and Augmented Reality (AR) consoles and the corresponding game selection.
Video Game Sales in the U.S. into 2020 (in $Billion) (Source: PWC)

Digital Video Games by Segment in the U.S. into 2020 (in $Billion) (Source: Statista)

AR/VR Investments to Date (Source: Digi-Capital)
Key Drivers:
- Disposable Income Per Capita: As disposable income rises, consumers will be more likely to make purchases on video games. Video games are considered as discretionary purchases. Per capita disposable income has been on the upward trajectory and it is expected to carry on
US Disposable Income (in $) is expected to grow at an annualized rate of 2% into 2021 (Source: IBIS World)
- Time spent on Leisure: As individuals have more leisure time, chances are higher they would allocate more time for video games. Time spent on leisure has been relatively flat and it is expected to decrease slowly going forward, representing a potential threat to the industry

Average Hours per day spent on Leisure & Sports by U.S. population by age from 2010 to 2015 (Source: Statista)
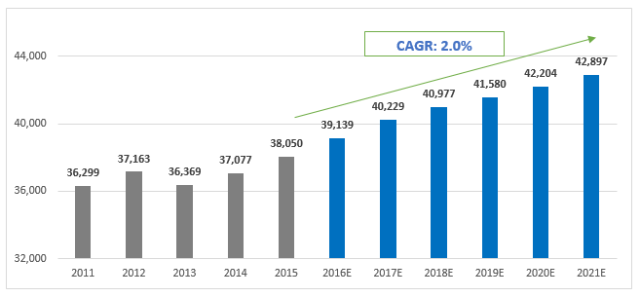
- Number of Households: A rise in number of households will likely lead to higher demand for consumer electronics, which includes video games. Historical trend has shown that number of households in the U.S. has been growing consistently in the past decade, resulting in continued growth opportunity for the industry

Number of Households in the U.S. from 2006 to 2016 (in millions) (Source: Statista)
Competitive Landscape:
The Industry has a relatively low concentration in market share, with the top 6 players contributing 43% of the total industry revenue in 2016. Yet each of the major players dominates in different types of business: Microsoft, Nintendo, and Sony dominate the hardware market (Eg: game console); Activision Blizzard and Electronic Arts dominate the software market; and GameStop is the dominant player in the retail market. Ultimately, what determines a company’s success and its corresponding market share are reputation and brand recognition. And these attributes are evaluated based on the quality and prevalence of the products & services the firm offers as well as the subsequent user feedback.
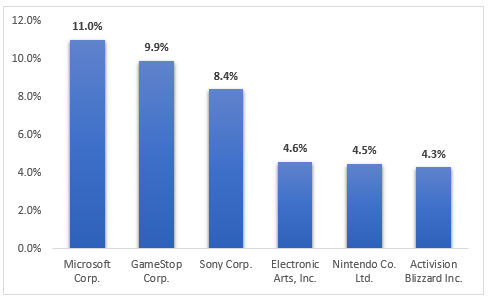
Major Player by Market Share (Source: IBIS World)
Products & Services:
Below a list of product & services offered by major players within the industry:
Microsoft: Xbox One, Kinect, Halo
GameStop: EB Games
Sony: PlayStation series (1-4), PSP, PSN
Electronic Arts: FIFA series, Need for Speed series
Nintendo: Nintendo DS series, Nintendo Wii & Wii U
Activision Blizzard: Massively multiplayer online games (MMOG) such as Diablo III, Call of Duty, and World of Warcraft
Industry Cost Structure:
The industry cost structure varies depending on which segment the company operates in. At the retail side of the supply chain (Eg: GameStop), companies spend most of their revenue on purchasing games, consoles, and accessories; and sell them to customers at low margins but high volumes. On the other hand, developers would incur substantial compensation and R&D expenses as the success of these companies lies in the ability for them to acquire the most talented individuals and allocate sufficient development budgets to create the next game-changer.

Industry Cost Structure as a % of Revenue (2016) (Source: IBIS World)
Competition & Barriers to Entry
- Intense competition among console developing companies (Eg: Microsoft/Sony/Nintendo) as it is critical for them to develop a console that is technologically efficient and compatible with most of the games in the market, thus securing customer’s choice
- Competition is less immense among retailers (think GameStop/Best Buy) as they tend to already have dominant footprint for selling their products
- Barriers to entry for video game industry is high and increasing as:
i.Existing brands tend to elicit considerable loyalty from gamers
ii.Costs of designing/manufacturing consoles & games from scratch are prohibitive, and
iii.The economies of scale that existing retailers will price the new competitors out of the market
Opportunity & Strategy:
Opportunities Inside GameStop:
- GameStop is expected to continue to deliver solid business results in its traditional business, i.e.: Physical Video Gaming, as Virtual Reality/Augmented Reality and new consoles are expected to accelerate the category growth in the future; However, in the short term, this elephant in the room will remain muted while Non-physical gaming segment continues to grow at a faster pace
- The Non-physical space is expected to account for about 50% of the company’s operating earnings

Operating Earnings Drivers into 2019
- Comparable store sales overall continues to grow at a moderate rate and the N.A. market remains resilient amid global sluggish economic growth

Comparable Store Sales Growth
- In addition, the two smaller categories: Digital & Collectibles are expected to contribute a larger share to the company’s top line and bottom line as follows:
- The U.S. Digital market is expected be growing at a CAGR of 3% into 2020 as discussed above; while GameStop’s Digital business has been expanding at a CAGR of 29% since 2010 (Note that Digital here includes “Mobile & Consumer Electronics” and Revenue in the “Other” category, excluding Collectibles)

- The U.S. Collectibles market is a $11 Billion industry and it is expected to grow to $16 Billion by 2019; and it will be a new platform for GameStop to fuel growth with a 2019 projected sales of $1 Billion

- GameStop’s PowerUp Rewards incentive program has been providing competitive advantage in each of the aforementioned categories as about half of its members make purchases on these categories


Opportunities Outside GameStop:
- The collaboration with AT&T and Apple has proved to be lucrative for GameStop. Spring Mobile is now AT&T’s biggest dealer in the U.S. In Q1 2016, the Technology Brands segment’s revenues surged 62.2% year over year
- The Technology Brands segment includes Simply Mac, Spring Mobile, and Cricket Wireless stores. Simply Mac sells the full line of Apple products, including laptops, tablets, smartphones and offers Apple certified warranty and repair services. Spring Mobile, sells post-paid AT&T services and wireless products through its AT&T branded stores. Cricket Wireless, is a new AT&T brand offering pre-paid wireless services, devices and related accessories

- On July 2016, GameStop has added 507 AT&T stores to its Technology Brands business, totalled at 1,421 AT&T Mobility stores. The segment is expected to sustain its growth momentum as the company is keen on expanding its footprint by opening more stores. The management is looking to reach about 2,000 stores for the Technology brands segment by 2019
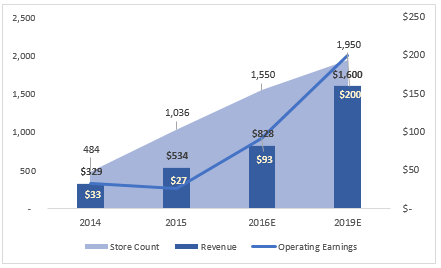
- The North American Telecom Services spending is expected to increase to $400 billion by 2019 from the current level of $350 billion. Over $1 billion of CapEx has been committed to expanding the Technology Brands at GameStop and the business is aiming to deliver $1.6 billion in sales and $200 million (i.e. ~25% of the $800 million total operating earnings projected for 2019) in operating earnings by 2019, up from $500 million and $29 million as of 2015

Telecom Services Spending in North America (in $Billion)
Financials:
- GameStop is looking to expand its business into other non-core segments such as Technology Brands, to capture the explosive growth and high margin business
- Revenue is expected to increase gradually as the Company is going through the transition period

Revenue by Segment (in $million)
- As a result, EBITDA & EPS are likely to increase steadily but at a faster pace going forward, as non-core segments generate higher margins compared to traditional business such as physical video games (FY2015: Digital and Mobile & Consumer Electronic segments finished the year with 79% and 50% gross margins, much higher than the core physical video gaming business)
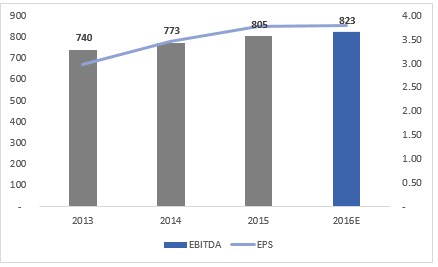
EBITDA & EPS (in $million, except for EPS in $)
- Free Cash Flow is expected to be in line with the historical trend for FY2016 as company continues investing in Technology Brands segment as well as returning value to shareholders through dividends and buybacks

FCF and Shareholder Return (in $million)
Valuation:

- 2016E Earnings (FY1): $3.80 FY1 P/E: 8.5x; 2017E Earnings (FY2): $3.93 FY2 P/E: 8.4x
- 2016E EBITDA (FY1): $823 FY1 EBITDA multiple: 4.3x; 2017E EBITDA (FY2): $842 FY2 EBITDA multiple: 4.2x
- Current share price (as of July 26, 2016): $31.25
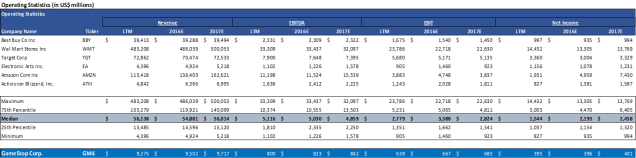
Public Comparables
Six Comparable companies are selected to construct the public comparables analysis.
- Comparable companies derived revenue from various sources, i.e.: consumer electronics/groceries/entertainment; No one comparable operates solely within one sub-sector (Eg: video games) as they tend to diversify into other industries
- GameStop is undervalued based on TTM and Forward-looking multiples

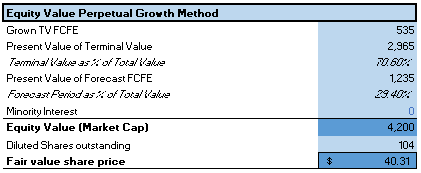
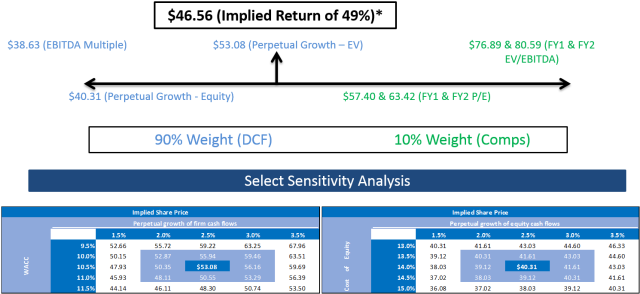
Implied Valuation:

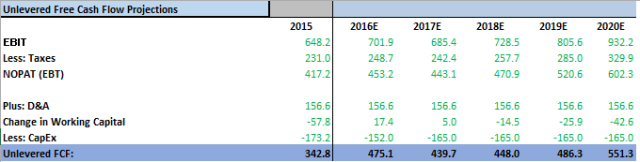
DCF Analysis:
- GameStop is expected to maintain its CapEx at a constant rate as it continues expanding into Technology Brands segment while strategically deploying capital in its core physical video games business
- 2.5% perpetual growth rate is used as historical US GDP growth has been trending between 0% – 5%

WACC Assumption:
Weighted average cost of capital is derived to be 10.5%, with the following assumptions:
- Risk-free rate: 10-Year US Treasury rate as of 2016-07-26
- Equity risk premium: long-term stock market return of 9-10% (source: Bloomberg)
- Cost of Debt: Weighted average of the 2 senior notes @ 5.5% and 6.75%

Undervalued against Peers:


Target Price Range:
Target price is arrived through a weighted average of DCF and Comps analysis, with 65% weight placed in the former and 35% allocated to the latter, as the author is more confident in DCF Analysis as Trading Comps results were skewed upward by a number of highly valued comparables.
Catalysts and Risks:
Long-term Catalysts:
- The Company’s continued effort in diversifying into the Digitals and Electronics businesses has proven effective as demonstrated by their increased ability to generate sales & margins in these segments
- The Collectibles business has been profitable as demonstrated by pop culture such as Star Wars/Marvel/Minecraft and the recent launch of Pokemon Go; the business is expected to triple its sales to $1 Bil by 2019
- Significant investment in the Technology Brands segment to leverage off the explosive growth in Mobile & Consumer Electronics business
- Tap into game publishing arena by offering resources to indie developers to produce games; expected to further improve physical and digital video game sales
Risks:
- Although the aforementioned pipeline is deemed to be robust to fuel future growth of the Non-”brick-and-mortar” businesses, it will take time for these to materialize while the traditional physical video game business is likely to continue its decline
- Failure to recoup invested capital and grow the Technology Brands segment as stated by management
- Increase in Digital download market continues to slow down the physical video game sales
Recommendation:
GME’s diversifying revenue and potential margin expansion are under-appreciated by the market, as investors are currently focused on the decline of the Company’s core business. Nevertheless, the long-term outlook of the company remains resilient as the investments in non-core business segments start to materialize.
- Recommend BUY/OVERWEIGHT Rating
- GME is forecasted to reach a price target of $55.68 for a 12 to 18-month horizon, representing a 78% upside potential
- Suggested Entry Range: Market Order as the stock is very over sold
Appendices:
Pro-forma Financial Statements:


Operating Statistics:
PowerUp Rewards:
The Company creates strong customer relationships through personalized offers, DLC targeting, trade generation, and Collectibles marketing
PowerUp Rewards provides incentive for customers to make purchases as:
- they expect to utilize the points earned from their transactions to redeem for other items, and
- they will receive member-exclusive products & services (Eg: magazines and discounts)

Market Shares Grows with PowerUp Rewards Membership

Significant Awareness of New Technology among PowerUp Pro Members

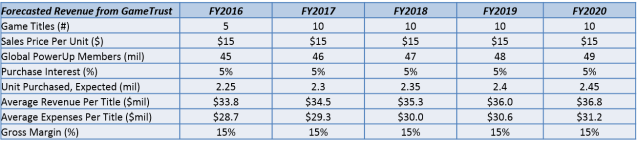
GameTrust: When Retailer is combined with Game Publishing
- The strategic partnership is an effort to diversify both the physical and non-physical sales
- The focus of GameTrust will be on indie games with a budget of up to $15 mil and the project is looking to release 5 – 10 games per year
- Current Partners: Insomniac Games, Ready at Dawn, Frozenbyte, and Tequila Works